
Data & Insights
Suprata Insights
Turn records from many systems and sources into trusted dashboards: a private view for every role, a public dashboard for everyone else, and plain-language answers to plain-English questions.
Overview
What Suprata Insights does
Suprata Insights pulls records and results from the systems and partners an organization already works with, checks and standardizes them every night, and turns them into dashboards people can trust. A leader sees the whole organization at a glance, a site manager sees only their location, a caseworker or counselor sees only their own people, and every number can be clicked to see what is behind it. Files that arrive in different layouts, names and units pass through the same mapping and quality checks before anything reaches a chart.
Built-in tools go beyond charts: an early-warning list that shows why each person was flagged, fair comparisons that hide groups too small to report, side-by-side comparisons, goals with baselines and targets, a report builder that saves and schedules reports, and a question box that answers in plain English and shows the exact query it ran. When the results are for the public, Insights adds a public map dashboard, alerts when a threshold or a sharp rise is reached, a weekly plain-language summary drafted by AI for staff to approve, and always-current widgets partners can embed on their own websites. Every sign-in, view, export and approval is recorded.
Who it’s for
Built for organizations like yours
Insights fits a wide range of organizations. Hundreds of organizations already run their work on the Suprata platform.
- School districts, charter networks and private schools
- State and regional education agencies and education service centers
- Colleges, universities and community colleges (retention, attendance, early alerts)
- Early-learning and after-school providers
- Courts, juvenile justice and probation programs tracking caseloads and outcomes
- Workforce boards and training providers
- Health systems, clinics and care-management programs tracking patients by care team
- Nonprofits and youth-serving organizations measuring program impact
- Cities and counties with performance and strategic-plan dashboards
- Housing authorities and social-service agencies with caseworker caseloads
- Multi-site private businesses (franchises, clinics, fitness and membership businesses) tracking attendance, retention and goals by location
- Tutoring, camp and enrichment businesses
- Regional councils and councils of governments
- County and city health departments
- State public health and environmental agencies
- Water, sewer and wastewater utilities
- Environmental monitoring and testing labs (public or private)
- Universities and research centers running surveillance or monitoring studies
- Hospitals, health systems and clinics tracking community illness
- School districts and campuses watching illness trends
- Airports, ports, corrections and large facilities with on-site sampling
- Nonprofits and coalitions publishing community data
- Private consultancies and contract labs that report results to many clients
- Any organization that must publish clean, comparable data from many sources
Features
Everything Insights can do
105 capabilities in 16 areas. Every one of them can be shaped to your rules.
Role-based dashboards
- District leader dashboard: key numbers, plan goals, 'needs attention this week', schools at a glance, weekly attendance, four-year trend
- Building dashboard limited to the principal's own school: students to check on, chronic absence by grade, weekly attendance
- Counselor dashboard for a caseload (e.g. last names A to G): students to see first and a seniors' readiness checklist
- Classroom dashboard for a teacher's own sections only: students to check on, fall screener, quarter progress grades
- Every page and every query limited to the signed-in role's scope (district, building, caseload, class)
- Pages a role may not see are hidden from the menu and blocked with a clear message
- Select any number to drill down to the students behind it
- Filters for year, school, level, grade and student group on every dashboard
- 'Data through' freshness date from the nightly refresh
Topic dashboards
- Enrollment by school, grade and student group, five-year trend, new to the district, school-by-grade table, CSV export
- Attendance and chronic absence by week, school, grade and student group, with a five-year trend
- Assessment and growth: achievement levels, levels by grade, growth vs. proficiency by school, growth percentile by grade, proficiency trend
- Fall benchmark screener results for the current year
- Grades: D and F rate by core course, mark distribution, missing work, list of students with a D or F
- Behavior: incidents by type, location and month, responses, suspension risk ratio by student group
- State accountability dashboard organized by the five state performance standards, with a subgroup table
- College and career readiness: graduation rate, readiness indicators earned, career pathways, postsecondary placement, where current seniors stand
Early warning
- Point-based early-warning score from attendance, attendance drop, prior chronic absence, suspensions, course failures, state test, screener and credits
- Every flag shows its reason, value, rule and data source
- Demographics are never used as risk factors
- High / moderate / low tiers, new-this-week flags, chart of what drives the flags
- Flagged-student list with paging and CSV export
Analysis
- Equity matrix comparing each student group with all students across measures
- Gap over time chart for any measure and group
- Compare any two groups: schools, grades, student groups or school years side by side
- Follow one graduating class over time
- Program effectiveness: participants compared with similar non-participants (including an honest 'no effect' example)
- Participation by year for each program
- Strategic plan goals with baseline, straight-line path, target, owner and on-track status
Student records
- Student list with search by name or ID, limited to the viewer's scope
- Student profile: why flagged, attendance, assessments, behavior, programs and readiness
- Every profile view is recorded in the audit log
- Presentation mode replaces names with initials and ID for screen sharing
Questions, reports and exports
- Ask a question in plain English; the answer uses the same governed definitions and shows the exact database query it ran
- Questions follow the viewer's role (a principal's query is limited to their school)
- Suggested example questions and a history of your recent questions
- Report builder from approved measures, grouped by school, level, grade or group
- Save reports to a library and schedule delivery (weekly, monthly, yearly) to named recipient groups
- Export to CSV and print; small groups suppressed in every export
Data pipeline and governance
- Nightly loads from each source: student information system, attendance, behavior, gradebook, state test files, benchmark screener, readiness files, staff directory, graduate survey
- Standard connectors described: OneRoster, Ed-Fi, secure file transfer, vendor APIs, directory sync
- Run history per source and records loaded per night chart
- Validation rules checked on every load
- Reconciliation report comparing dashboard totals with source systems and state-reported figures
- Data-flow diagram
- Data dictionary: one definition per measure, used everywhere, with privacy rules and data model
Privacy, roles and audit
- Groups under 10 people suppressed everywhere, including exports
- Sensitive fields (such as lunch status) restricted by role
- Roles matrix showing who can see what
- Audit log of role switches, student views, exports, schedules, questions and denied access
- Quick-start guide for each role
- Times shown in the viewer's own time zone
- Data never sold, never used for advertising or to train AI models
Public dashboards and multi-source data
Public dashboard
- Home page with the region-wide level and trend for each tracked target, the week covered and the population served
- Five-step color level scale (Very low to Very high) with a level key on every view
- Trend direction chip (increasing, decreasing, steady) with the 15-day percent change
- Interactive map of service areas colored by level, with a matching table for screen readers and small phones
- Small areas under a population floor are hidden on the public side but still counted in regional totals
- Detected / not detected view for rare targets, with a 12-week results timeline
- All-targets grid: every area and every target at a glance, plus side-by-side regional trend charts
- Area list and per-area page with population, facility, sample type, collection schedule and trend charts
- Trend charts show each sample, a smoothed trend line and a confidence band, with selectable time ranges
- Notice when a data source is running late
- Plain-language 'How to read this' page explaining levels, methods and data limits
- Weekly summary page with the current approved plain-language summary and earlier summaries
Open data and sharing
- CSV downloads: current levels, regional series, area list and data dictionary
- Read-only public JSON API: levels, regional series, areas, per-area series, latest summary
- Embeddable widgets (current level card or trend sparkline) added to any website with one line of code
- Example partner page showing widgets embedded on a third-party site
- Widget builder in the staff workspace with live preview and copy-paste code
Data intake and standardization
- Upload a partner or lab results file (CSV) with automatic column detection
- Two-step load: check first with a row-by-row report, then commit
- Crosswalk maps each source's own names for sites, targets and units to one common model
- Automatic unit conversion (per liter, per milliliter, per microliter, per gram of solids)
- Per-source method factors with uncertainty ranges so different lab methods compare fairly
- Normalization page showing each step from raw result to comparable value on a worked example
- Split-sample study chart comparing the same samples run by three labs
- Feed status for each source: push API, spreadsheet upload or secure file drop, with expected turnaround
- Batch history with rows accepted, flagged, held and rejected
- Machine intake API endpoint for lab systems (key required)
Data quality
- Ten automatic rules on every row: required fields, known units, duplicates, plausible flow, sample strength, recovery control, below detection limit, timeliness, statistical anomaly, site and target mapping
- Each rule has a severity: reject, warn, info or hold for review
- Statistical anomaly check holds outliers off the dashboard until a person decides
- Review queue to keep or exclude held values, with a required reason
- Nothing is silently dropped; every decision is logged
Alerts and notifications
- Alert rules: level reaches a threshold, rapid rise over 15 days, rare target detected, source feed late, results held for review
- Staff can change thresholds, minimum levels and turn rules on or off
- Alert log with acknowledge and resolve, with notes
- Notification preview showing exactly what the email or text says
- Alerts fire automatically when a newly loaded file crosses a rule
Plain-language summaries
- AI drafts a short weekly public summary from the published numbers
- Shows the facts the draft was built from, plus a reading-grade score
- Staff edit and approve; nothing reaches the public page without approval
- History of published summaries with who approved them and when
Analysis and planning
- Regional overview for staff: current levels for every area including internal-only ones
- Per-area staff page with raw recent results and quality flags
- 14-day outlook with an uncertainty band (illustrative)
- Backtest showing how the forecast method would have done over the last 12 months
- Data model page with an entity diagram and full data dictionary
Security, roles and audit
- Role-based staff workspace: epidemiologist/analyst, lab data manager, communications officer, administrator
- Each role sees and can do only what it needs (approve, acknowledge, load data, edit rules, manage widgets, manage keys)
- Quick role switcher for demonstrations
- API keys for agency endpoints (raw results, quality flags, alerts), rotatable and logged
- Audit log of every sign-in, file load, quality decision, rule change, alert acknowledgment and summary approval
- Times shown in each viewer's own time zone
Screens
See Insights at work
Real screens from the working copy, filled with made-up sample data. Click any screen to enlarge it.
How it fits
One platform underneath
Suprata is a versatile workflow and business intelligence platform that delivers the power of custom software with ease and affordability. Insights is built on it, so it shares the same engine, records and controls.
Workflow & automation
Approvals, work queues, reminders and rules move every Insights request forward without anyone chasing it.
Business intelligence
Live dashboards for every role and custom reports built from your Insights data, with an AI report builder.
Customer portal
The people you serve sign in to apply, book, pay, upload documents and check status, day or night.
Payments & billing
When Insights takes money, card and bank payments, invoices and refunds land in one ledger.
Integrations & API
A documented API, webhooks and exports connect Insights to the systems you already run.
Click around a working copy
The working copy of Insights is filled with realistic, made-up data. There is no sign-up and no password. Pick a role and explore. Your changes stay in your own copy.
Related
Often used together
 Data & Insights
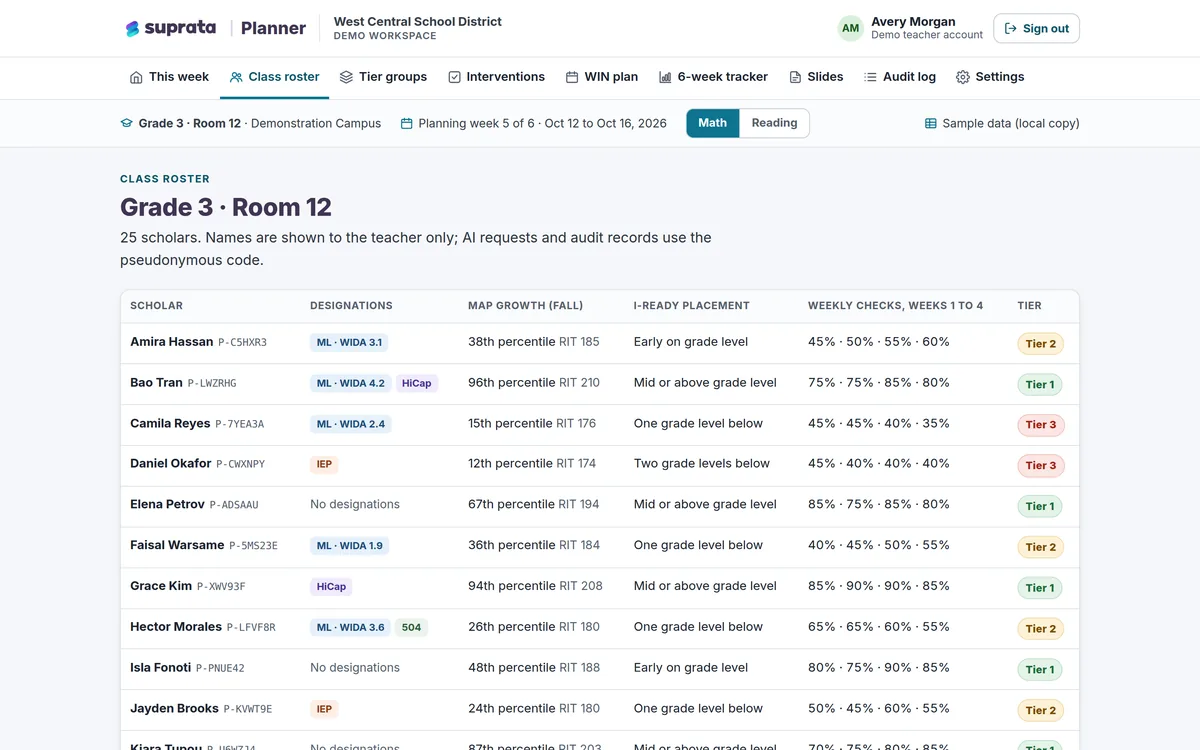
Suprata Planner
Weekly small-group planning for teachers: sorts students into support tiers from their scores, suggests approved interventions, builds the schedule…
Learn more
Data & Insights
Suprata Planner
Weekly small-group planning for teachers: sorts students into support tiers from their scores, suggests approved interventions, builds the schedule…
Learn more
 Meetings & Public Engagement
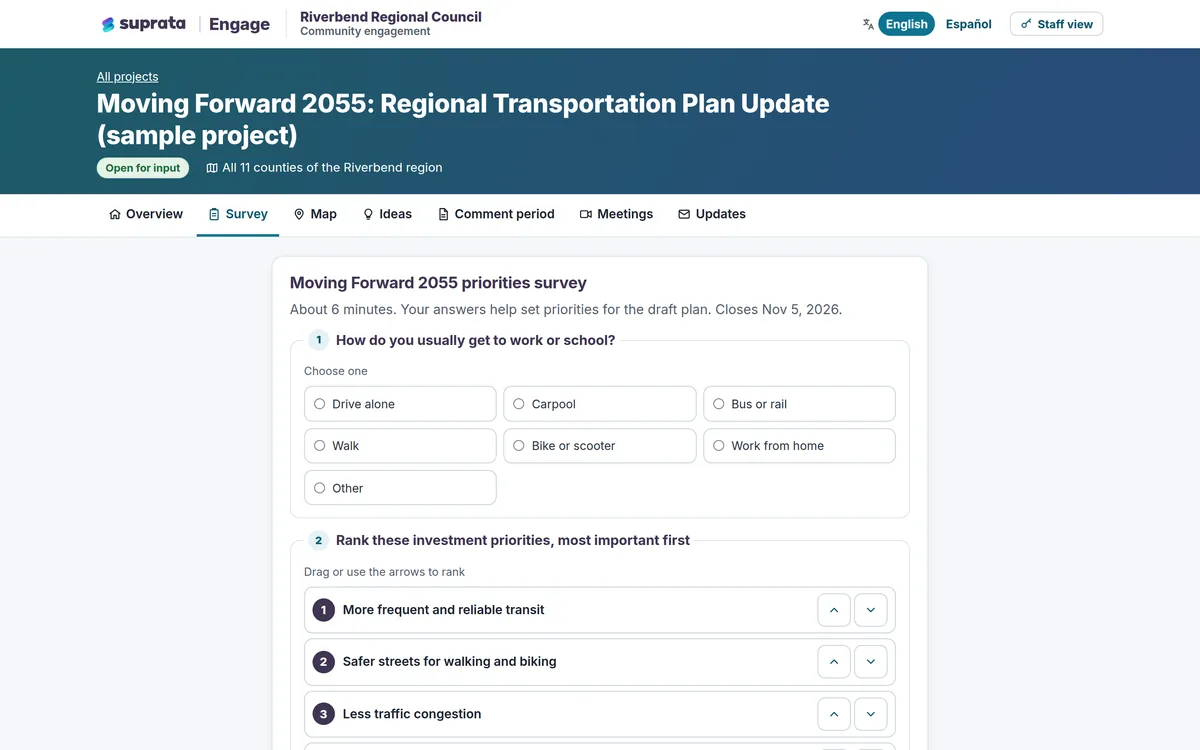
Suprata Engage
Hear from more of your community with surveys, maps, idea boards, online meetings and formal comments, and turn the input into clear reports.
Learn more
Meetings & Public Engagement
Suprata Engage
Hear from more of your community with surveys, maps, idea boards, online meetings and formal comments, and turn the input into clear reports.
Learn more
 Grants, Benefits & Payments
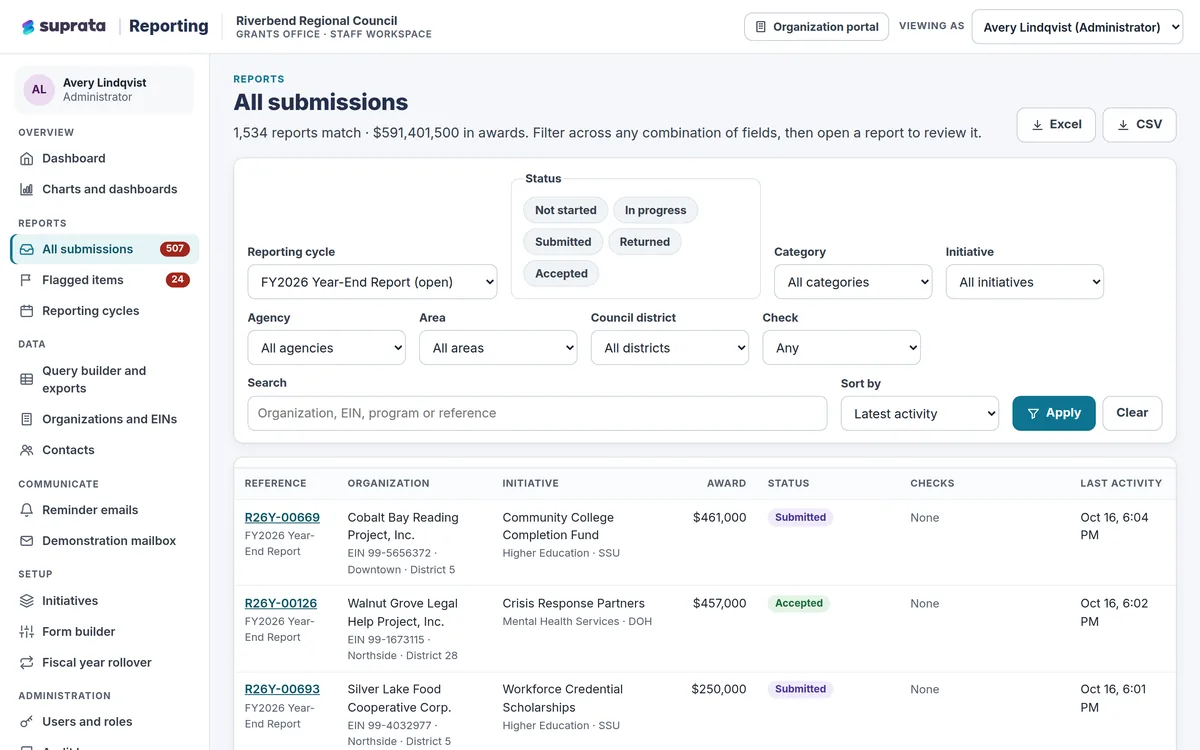
Suprata Reporting
One secure place for funded organizations to file their reports and for the funder to review, flag, export and chart every dollar.
Learn more
Grants, Benefits & Payments
Suprata Reporting
One secure place for funded organizations to file their reports and for the funder to review, flag, export and chart every dollar.
Learn more
Pricing
Ask about pricing for Insights
Every organization is different, so we price Insights around your size and needs. Tell us what you run and we’ll come back with a clear number.