A dashboard for every role
Owners see the money. Technicians see their next visit and directions. The front desk sees arrivals. Each role starts on the right home screen.

Business intelligence
Every job, booking, invoice and payment flows straight into live dashboards and reports. There is nothing to export and nothing to reconcile, because the numbers come from the same record your team works in.
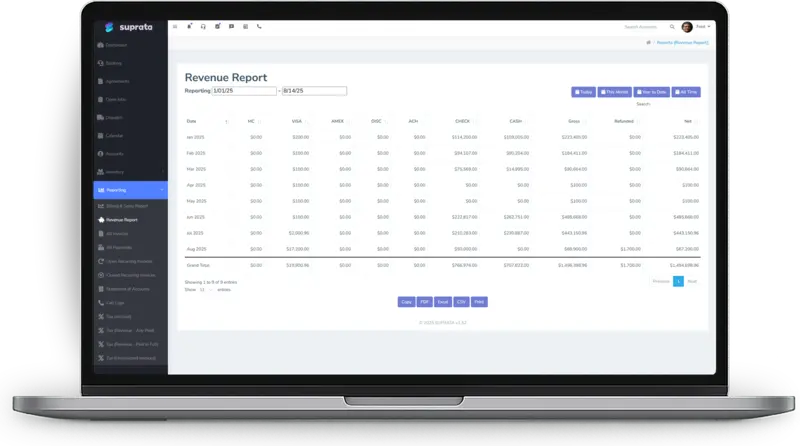
Suprata is a versatile workflow and business intelligence platform that delivers the power of custom software with ease and affordability. Buy Suprata Suite tonight and be set up in minutes. Then shape it as far as your business logic, intelligence and workflows need.
What you get
Most business intelligence tools need a data team and a nightly export. In Suprata, the dashboards and reports read the live record directly.
Owners see the money. Technicians see their next visit and directions. The front desk sees arrivals. Each role starts on the right home screen.
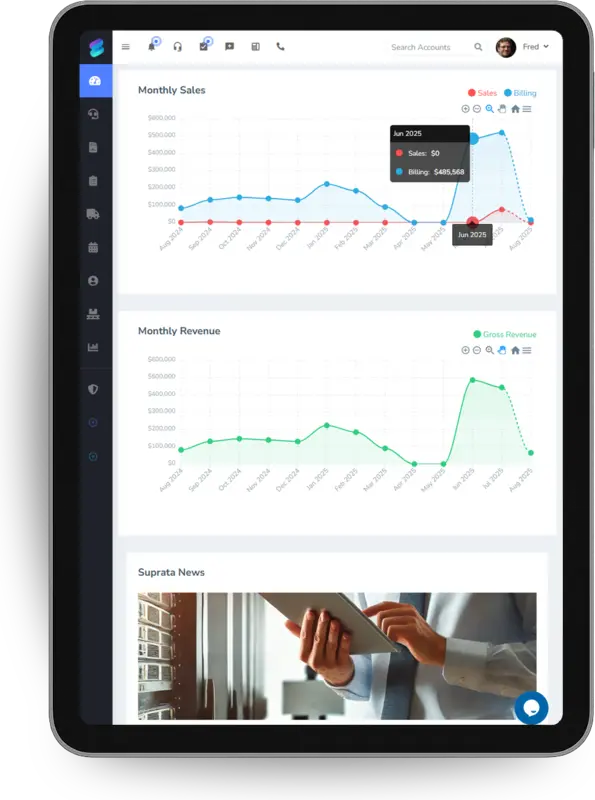
Goal rings fill up through the month, with a tick showing where you should be today. Compare month over month and year over year.
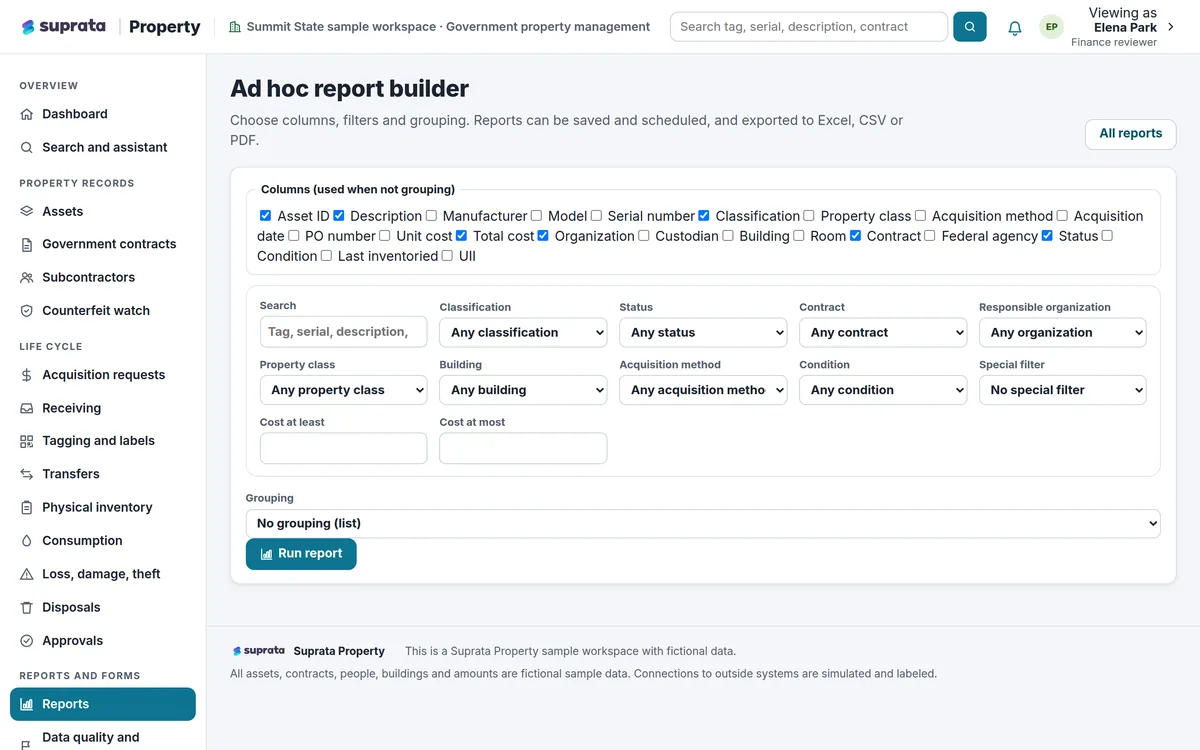
Report on jobs, invoices, payments, reservations, agreements, workflows and more. Break it down, filter it, compare periods, save it and share it.
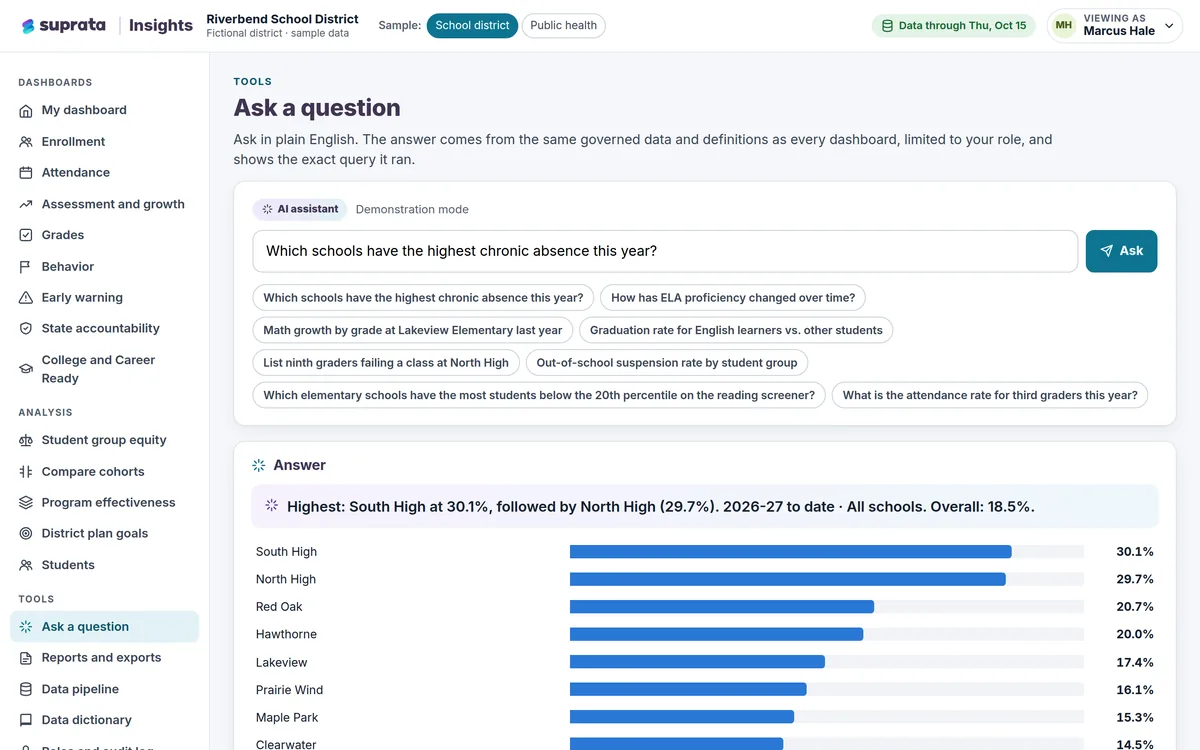
Type the question the way you would ask a colleague. The assistant builds the report, runs it and tells you what it assumed.
Billing and sales, collected cash, aging, statements, tax and business unit revenue, with filters that do not mislead.
Reading the Billing & Sales ReportThe Aging Report — Who to Chase First
Export any custom report to a spreadsheet as a CSV file, or print just the report.
Role dashboards
Tell Suprata what kind of organization you are. Each role then starts on a dashboard built for that job, and people can rearrange their own.
Help articles:Choosing dashboards for each roleYour home dashboard
Dashboards by kind of organization
Pick your main kind of business, then tick anything else you also do. Your roles choose from the matching set.
| Your main kind of business | Its dashboards |
|---|---|
| Service and jobs | Owner, Operations Manager, Sales, Field Technician, Dispatcher, Service Counter |
| Reservations and rentals | Owner, Property Manager, Front Desk, Bookings and Sales |
| Memberships and subscriptions | Owner, Membership Manager, Membership Sales |
| Retail and counter sales | Owner, Store Manager, Register |
| Every kind of business | Accounting, Customer Service, My Day |
The AI report builder
At the top of Custom Reports is Ask for a report. Type a question, and the assistant builds the report, runs it, and tells you in a sentence or two what it chose. Then keep going: “now show it by month”, “only the last quarter”.
Help articles:Custom Reports — Build Any Report, or Just Ask for One
Built-in reports
Ready the day you start. Each one is documented in the help center, including how to read it without fooling yourself.
What you sold, billed and collected, by invoice date or payment date.
Who owes what, in current, 1 to 30, 31 to 60, 61 to 90 and 90-plus day buckets, so you know who to call first.
Each customer’s receivables on one page, with a link to pay.
Every active recurring schedule, when it bills next and what it brings in each cycle: your monthly recurring revenue.
What you collected by tax category and jurisdiction, mapped to the boxes on your filing.
What each location or department earned, and who holds whose money at month end.
Business Unit Revenue — What Each Shop Earned, and Who Holds Whose Money
Every part received, used, returned or adjusted, linked to the job, invoice or purchase order behind it.
Tonight’s occupancy and arrivals on the Owner dashboard, and length of stay or occupancy trends in custom reports.
Build your own
What you are reporting on, what to calculate, how to break it down and which records to include. That is the whole model.
Help articles:Custom Reports — Build Any Report, or Just Ask for OneBusiness units
From the help center
Every capability on this page is documented in the Suprata help center. Start with these articles.
Ready when you are
Suprata is a versatile workflow and business intelligence platform that delivers the power of custom software with ease and affordability. Start with Suprata Suite on your own tonight, or let our team shape it around the way you work.